
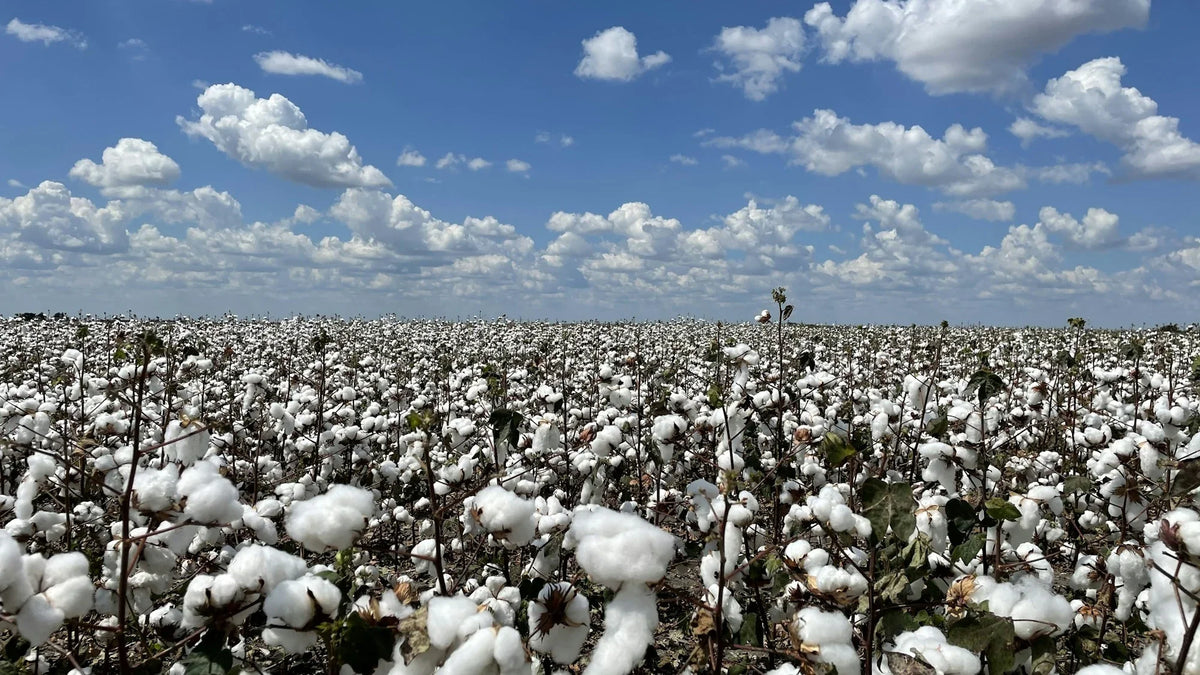
From sowing to harvest, a cotton field changes every week. Seeing those changes together makes the season easier to understand. FieldFusion brings satellite NDVI maps into one place so growers can compare dates, spot differences across plots, and decide where to look more closely.
This general cotton example follows an April-to-October growing season through seven map comparisons. The months illustrate this example’s seasonal sequence; planting dates and crop stages vary by region, variety, and weather.
Want to see the changes in your own field? Register for FieldFusion and start your free 7-day Pro trial to explore your field’s NDVI and compare imagery from two dates.
The hardest part of managing cotton: seeing what has changed
Walking a field provides detail, but keeping track of every plot throughout a season is demanding. A weak patch may be easy to miss, and an uneven canopy may be difficult to judge from the field edge. Comparing satellite maps gives the team a shared view of where growth patterns differ and how they change over time.
NDVI describes vegetation greenness. It helps direct attention, while field observations explain what is happening. A low-value area is a reason to investigate, rather than an automatic diagnosis of nutrient deficiency, pests, or water stress.
April · Sowing: establish the starting point
The season begins with field preparation and sowing. Before substantial canopy development, soil and ground cover have a strong influence on the satellite view. Keeping an early image provides a useful baseline for later comparisons.
In the April-to-May comparison below, start by checking the same field boundaries and noting the early-season appearance. Later changes become easier to discuss when the team has a common starting point.

May · Emergence: find the patches worth checking
As seedlings establish, the question shifts from “Has the field been planted?” to “Is growth becoming consistent?” Comparing May 8 with May 15 helps reveal areas that are developing differently from nearby plots.
What to do next: visit the contrasting areas and check stand establishment, soil conditions, and irrigation. Confirm missing plants or weak growth on the ground before considering replanting or changing the management plan.

June · Squaring: review water and nutrition by zone
As the crop moves toward squaring, the developing canopy changes the NDVI pattern. The May-to-June comparison provides a way to review which parts of the field are changing together and which deserve closer inspection.
What to do next: combine the map with crop checks, irrigation records, and soil or tissue information where available. If those checks justify different treatments, use the findings to inform management zones and prescription planning. NDVI alone does not determine fertilizer rates or confirm that a drip system can apply them by zone.

July · Flowering and boll setting: keep scouting focused
The June 27 and July 17 views show more extensive green coverage across the highlighted plots. The crop is now being considered in the flowering and boll-setting part of this example’s seasonal workflow.
A dense canopy still needs field scouting. NDVI can help organize visits to areas showing unusual changes, but it does not identify cotton bollworm, mites, or disease. Base any spraying decision on confirmed field findings and locally appropriate crop-protection guidance.

August–September · Boll filling: watch for changes in the pattern
During boll filling, regular comparisons help the team keep track of canopy development and notice areas that change differently. The September 10 and September 20 maps provide a late-season checkpoint in that review.
What to do next: compare map patterns with irrigation history, weather, and observations of the crop and bolls. Use the combined picture to decide which plots need attention and which can continue under the current plan.

October · Harvest preparation: follow the transition, then check the crop
In the late-September and October comparisons, several plots shift toward yellow-green and orange in the displayed NDVI palette. This makes the late-season change visible across the field.
Declining greenness may accompany senescence or defoliation, but map color alone does not establish maturity or harvest readiness. Review boll opening and maturity, leaf condition, weather, and moisture in the field before deciding when to apply harvest aids or bring in the harvester.


From experience to a visible seasonal record
The value of a full-season view is continuity: the team can return to the same plots, compare dates, and connect visible changes with field observations and management decisions.
- More focused scouting: use contrasting areas as a starting point for field visits.
- Better informed nutrition planning: discuss zones using maps alongside crop and soil evidence.
- Clearer harvest preparation: follow the late-season transition and confirm readiness in the field.
This example illustrates a monitoring workflow. It does not quantify yield gains, input savings, or the results of any particular treatment.
Further reading
See your own field with a free 7-day Pro trial
You have seen how NDVI comparisons help tell the story of a cotton season. Now explore the story of your own field. Register for FieldFusion to get a free 7-day Pro trial.
During your trial, check your field’s available NDVI imagery whenever you log in and select two image dates to compare side by side. See where the pattern has changed, identify areas to visit, and make your next field check more focused.
- Create your FieldFusion account and start your free 7-day Pro trial.
- Add or select your field and review its available satellite NDVI imagery.
- Compare two dates to see how the same areas have changed over time.
Start with one field and two dates. Turn the seasonal example above into a useful first look at your own crop.
NDVI views reflect available satellite image dates. Image availability depends on satellite coverage and cloud conditions.